We are God’s children working together to be our best in love, learning, service and worship.

We are God’s children working together to be our best in love, learning, service and worship.

We are God’s children working together to be our best in love, learning, service and worship.

We are God’s children working together to be our best in love, learning, service and worship.

We are God’s children working together to be our best in love, learning, service and worship.

We are God’s children working together to be our best in love, learning, service and worship.

We are God’s children working together to be our best in love, learning, service and worship.

We are God’s children working together to be our best in love, learning, service and worship.

We are God’s children working together to be our best in love, learning, service and worship.

We are God’s children working together to be our best in love, learning, service and worship.
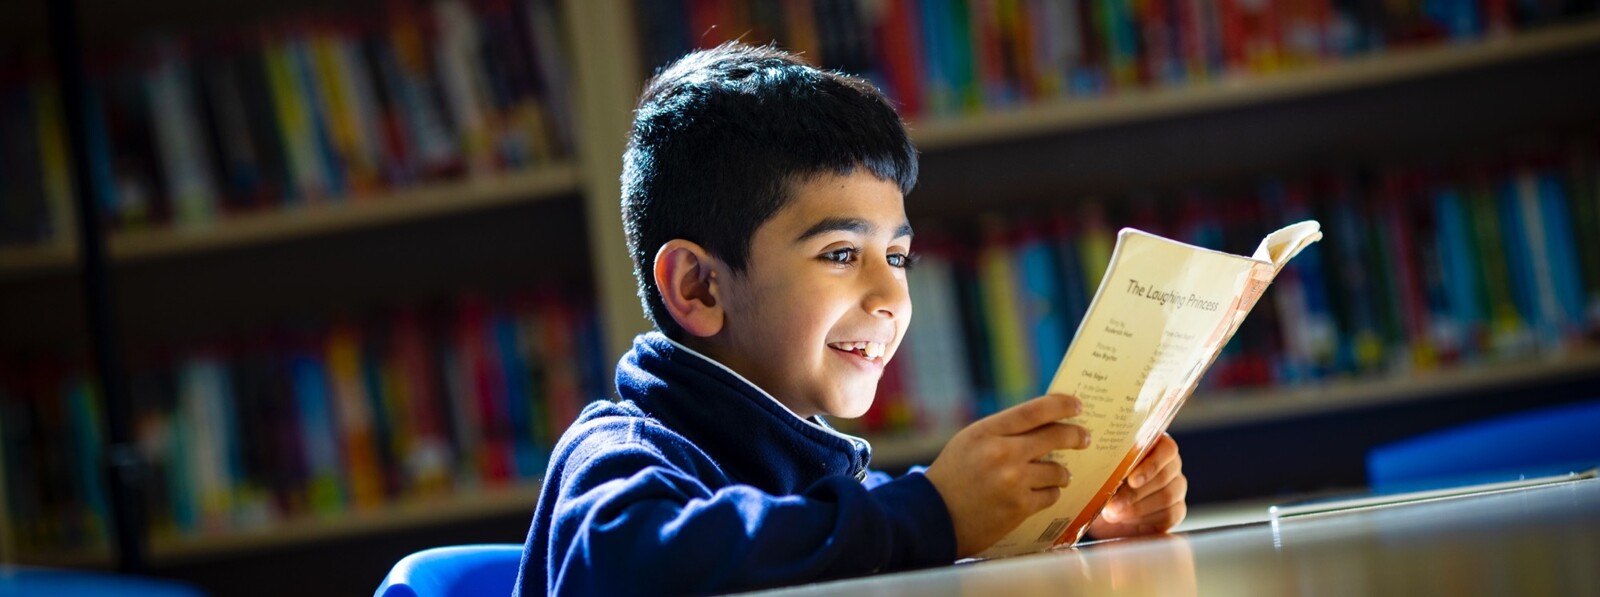
Welcome to St Bede's Catholic Middle School
"HAVE LIFE AND HAVE IT TO THE FULL" John 10:10
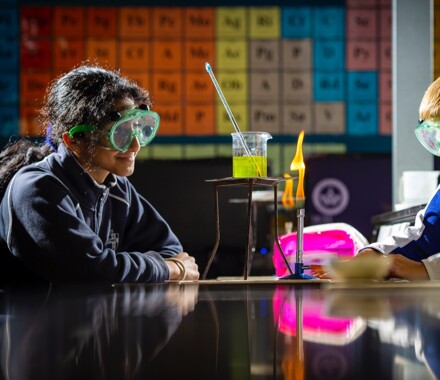
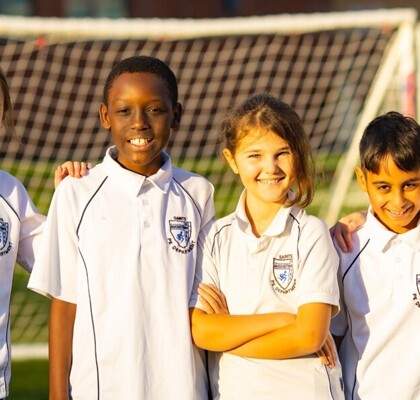
At St Bede’s we provide Catholic education to pupils aged 9-13 years from our partnership schools in Redditch and Bromsgrove. We are an academy, part of the Our Lady of the Magnificat Catholic MAC – allowing us to be involved in an exciting development of Catholic education in Worcestershire and Warwickshire with schools in our Multi Academy.
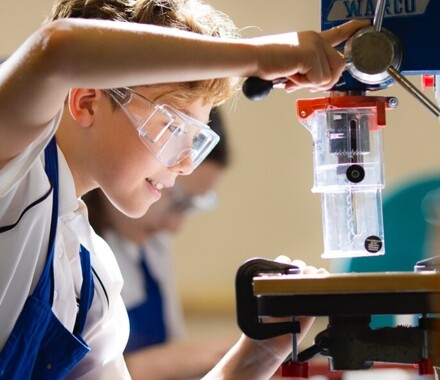


@StBedesMiddle - April 24
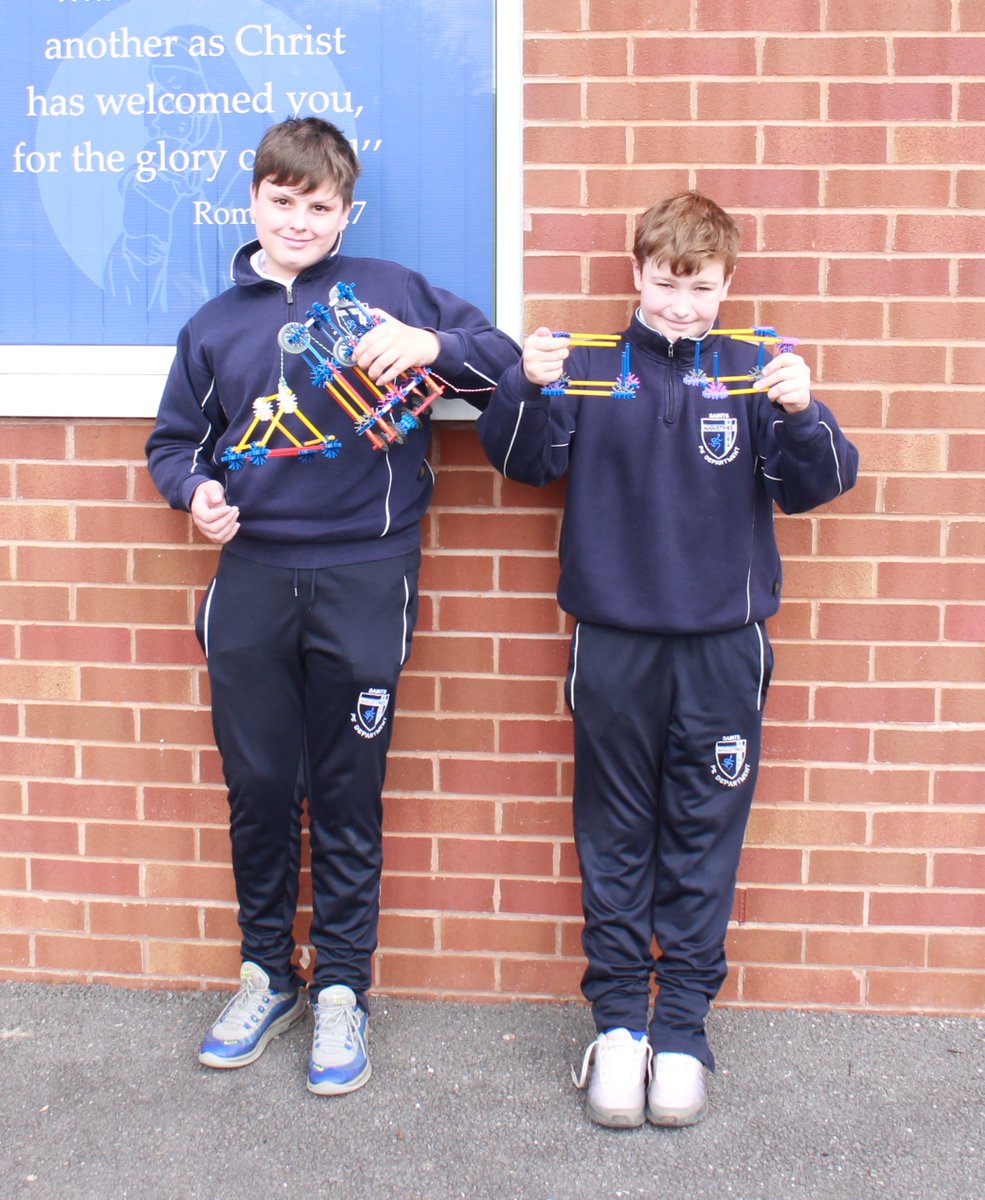
Today, some of our year 6 pupils competed in the Worcestershire STEM Challenge. Their task was to create and build their own bridge installation system. Filip and Oliver have been selected to represent St Bede’s at the Worcestershire STEM finals in June. pic.twitter.com/qYPgPXnlOF— St Bede's Catholic Middle School (Academy) (@StBedesMiddle) April 24, 2024
Read More


UpcomingEvents